 |
 |

|
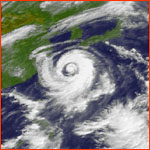
Origins—Ground Zero by Mark Hoover What is El Niño? In a narrow sense, it's a giant puddle of heated water that sloshes across the Pacific Ocean. From NASA satellites, we can see the big picture; a massive pool of warm seawater, half again as large as the United States, builds in the western Pacific over a period of months. This gargantuan wedge of warm sea contains 20 or 30 times as much water as all the Great Lakes put together. In one sense, it's like an iceberg; most of it is submerged, but part of it sticks out above the sea's surface, as the wedge floats in the surrounding ocean. Partly because warm water is less dense than cool water, and also partly because El Niño waters are less salty than normal seawater. (It's always raining over an El Niño, and the rainwater dilutes the sea.) Both of these conditions contribute to buoyancy. A sharp temperature and density change—called the thermocline—floats about 100 meters below the surface, and marks the bottom of this warm "iceberg." The top layer of water may protrude 150 or more centimeters above sea level. This isn't so hard to picture if you think about tides, which also pile water up above sea level.  El Niño's energy reserve is vast, almost inconceivable. It contains more energy than has been procured from all the fossil fuels burned in the United States since the beginning of the century - that's all the gasoline in all the cars, the coal in all the power plants, the natural gas in all the furnaces. It would take more than a million large power plants, at 1,000 megawatts each, running full tilt for a year, to heat the ocean that much. Or if you want to think in more violent terms, that's all the energy produced by about half a million 20 megaton hydrogen bombs, gone into heating water. Scientists are divided on what triggers the buildup. Some say it begins when strong west-blowing winds near the equator-the trade winds-push against the sea, and drive sun-warmed surface waters against Indonesia and Australia. There the waters pile up like driftwood blown into a harbor.
There are other, more elaborate theories about what causes El Niño, but one element seems common to all of them: when you look closely, you see a dog chasing its own tail. The truth is, no one knows what really causes El Niño. It might very well be the last El Niño that starts the next one. The official scientific name for El Niño, ENSO (El Niño-Southern Oscillation) reflects an understanding of this teeter-totter nature. An oscillation is a reverberation back and forth between two states, like between summer and winter. El Niño is one extreme of a years-long oscillation in the entire pacific basin and the atmosphere above it. As the cycle unfolds, an "anti-El Niño," dubbed La Niña, appears as El Niño disappears. Like a mirror image of El Niño, it produces extreme weather and abnormal conditions in the western Pacific similar to those El Niño produces in the east. Back and forth, east and west, this cycle has run continuously for many thousands of years.
Asking why El Niños occasionally reach giant proportions- as this year's has-is like asking why one thunderstorm is larger than all the others in a summer, or why two dice come up snake eyes only once in three dozen tosses. The answer is hidden in the laws of probability. Climate science is all about understanding probabilities. El Niño is a climate phenomenon, and despite all the hype and dire predictions this El Niño has generated, no one can say exactly what its effects will be. Scientists can, however, assign probabilities to its possible effects. Will California be deluged? There's a 60 percent chance of double the
normal rainfall, and a 10 percent chance of triple. (There's also a 10
percent chance of drier than normal.) Will Florida be cloudier and cooler
than normal? There's a 70 percent chance the answer is yes. Will the
Galapagos Islands be drenched? There's over a 95 percent chance that the
answer is yes-a virtual certainty. What you see when you look at a
That doesn't mean we can't make useful probability predictions, though. Here's a question for you: if the weather forecast calls for a 70 percent chance of rain tomorrow, do you carry an umbrella? How about 30 percent? We all have some sense of probability when it has real effects on our lives. Because it affects the entire world's weather system, El Niño has lots of real effects on lots of lives, all expressed in this same probabilistic way.
But how exactly is it that El Niño—after all no more than a large pool of water in the Pacific—can wreak havoc halfway around the world? It is because El Niño is inextricably bound up in a Global Weather Machine. Photos/Images: (1) NASA Goddard Space Flight Center; (2) NOAA; (3) © T.W. Swetnam and A.C. Caprio; (4) NASA.Anatomy of El Niño | Chasing El Niño | El Niño's Reach Dispatches | Resources | Mail | Site Map | El Niño Home Editor's Picks | Previous Sites | Join Us/E-mail | TV/Web Schedule About NOVA | Teachers | Site Map | Shop | Jobs | Search | To print PBS Online | NOVA Online | WGBH © | Updated November 2000 |
||||||
 Scientists looking back through time find that El Niño has left tantalizing
records of its past appearances in unexpected places. Signs can be read in
Arizona tree rings and Himalayan ice-core layers. Corals in New Guinea and
lake bottoms in the Sierra Nevada attest to previous comings (come back on
February 10 for "El Niño's Reach Into Living Things" to
find out more). Although the cycle is not as regular as the seasons, we
can count on El Niño and its sister La Niña appearing about 30 times per
century, with intervals as short as two years and as long as 10. Only a
few of those appearances will be whoppers like 1982 or 1997; it's the big
ones that tend to grab our attention.
Scientists looking back through time find that El Niño has left tantalizing
records of its past appearances in unexpected places. Signs can be read in
Arizona tree rings and Himalayan ice-core layers. Corals in New Guinea and
lake bottoms in the Sierra Nevada attest to previous comings (come back on
February 10 for "El Niño's Reach Into Living Things" to
find out more). Although the cycle is not as regular as the seasons, we
can count on El Niño and its sister La Niña appearing about 30 times per
century, with intervals as short as two years and as long as 10. Only a
few of those appearances will be whoppers like 1982 or 1997; it's the big
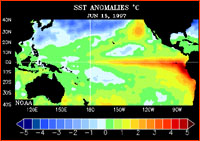
ones that tend to grab our attention.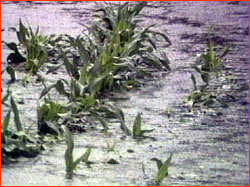 probability map of El Niño's effects is that,
roughly, the closer you are to El Niño's Ground Zero, which is the tropical
Pacific ocean, the higher the probabilities of predictable effects become.
In North America, which is halfway between the equator and the pole, not
many of El Niño's predicted effects have higher than about a 60 percent
probability. That's not a flaw of science as much as a recognition that in
the temperate zones far from the center of the action, El Niño's day-to-day
effects can never be fully predictable. If you want to be trendy, you can
say this is because Earth's weather machinery is chaotic, a property of
many natural systems which unfold in mysterious and complex ways.
probability map of El Niño's effects is that,
roughly, the closer you are to El Niño's Ground Zero, which is the tropical
Pacific ocean, the higher the probabilities of predictable effects become.
In North America, which is halfway between the equator and the pole, not
many of El Niño's predicted effects have higher than about a 60 percent
probability. That's not a flaw of science as much as a recognition that in
the temperate zones far from the center of the action, El Niño's day-to-day
effects can never be fully predictable. If you want to be trendy, you can
say this is because Earth's weather machinery is chaotic, a property of
many natural systems which unfold in mysterious and complex ways.