|
 |
|
Rise in initial public offerings Back to The Impact of Online Trading 
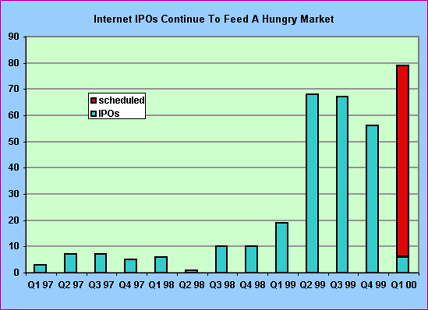
This graph shows the precipitous rise of Internet initial public offerings, both actual and scheduled, from 1997 through the first quarter of 2000. Graph/Source: IPO Monitor The Formula That Shook The World | Impact of Online Trading A Trader's Lexicon | Play a Virtual Market | Resources Transcript | Site Map | Trillion Dollar Bet Home Editor's Picks | Previous Sites | Join Us/E-mail | TV/Web Schedule About NOVA | Teachers | Site Map | Shop | Jobs | Search | To print PBS Online | NOVA Online | WGBH © | Updated November 2000 |